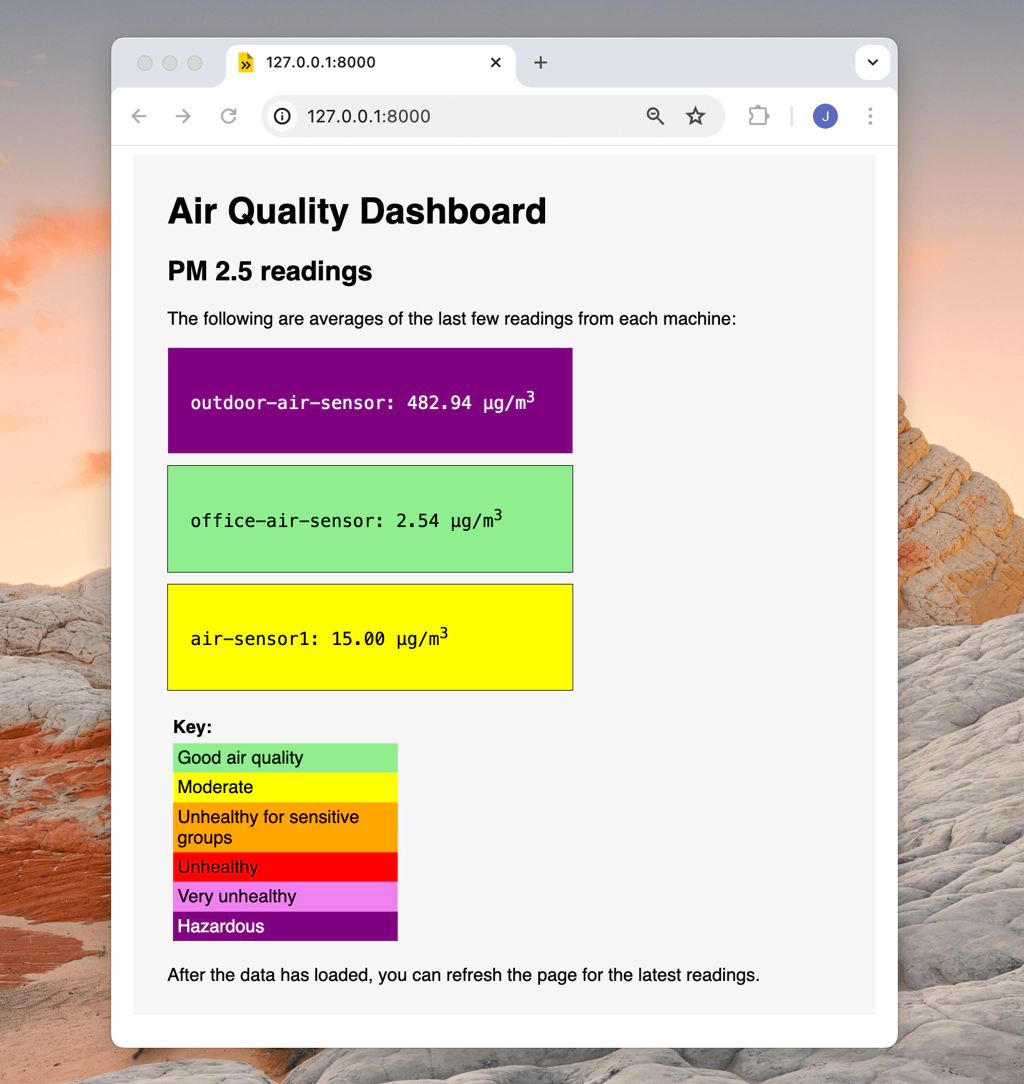
Let's visualize sensor data in Viam with a third-party tool, such as Grafana. In this tutorial, you'll need a machine connected to the Viam app with a configured sensor component, such as the pms7003, to collect air quality measurements, originally captured for our Automate air filtration with air quality sensors codelab.
Prerequisites
- Familiarity with MQL or SQL queries
What You'll Learn
- how to capture sensor data with Viam
- how to set up data management with Viam
- how to visualize sensor data in Viam with a third-party tool, such as Grafana
- how to use the MongoDB plugin with Viam and Grafana
- how to create a Grafana dashboard using the MongoDB data source
What You'll Need
- A Grafana instance. You can use either Grafana Cloud or a local instance of Grafana Enterprise. This tutorial will use Grafana Cloud (free trial available).
- A machine connected to the Viam app with a configured sensor component, such as the
pms7003sensor mentioned above. - Install the Viam CLI to manage your Viam machines and resources from the command line.
What You'll Build
- A Grafana dashboard to monitor real-time air quality sensor data with Viam
Watch the Video
Follow along with the step-by-step video.
To capture data from your machine and sync to the Viam app, add the data management service and configure data capture for your sensor component.
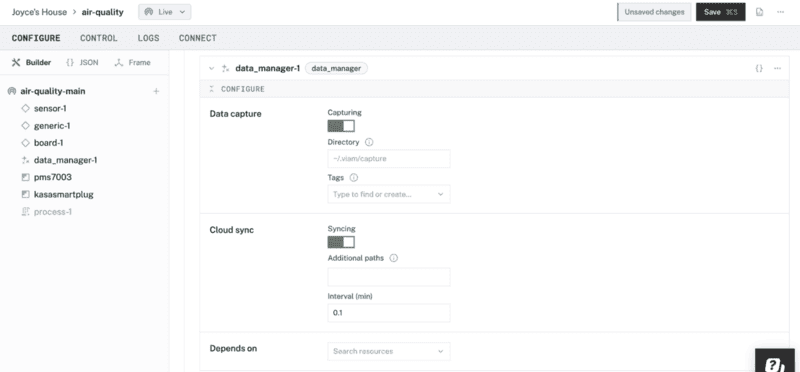
Add the data management service
- From the Viam app, find your active machine and navigate to the CONFIGURE tab.
- Click the + icon in the left-hand menu and select Service.
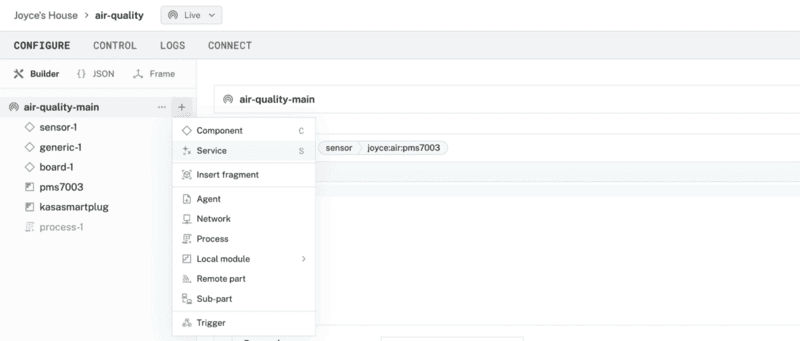
- Select data management.
- Leave the default service name
data_manager-1, then click Create.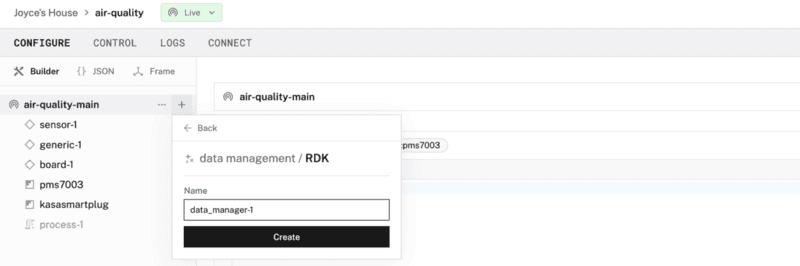
- On the corrresponding panel that appears, review the default settings to capture data locally and sync captured data files to the Viam app. then click Save in the top-right corner of the screen.
Configure data capture for your sensor
Now that you added the data management service, it's time to configure data capture for your sensor so that we can visualize this time-series data.
- Under the CONFIGURE tab in the Viam app, find the panel for the configured sensor component.
- Under the Data capture section, click Add method to enable data capture for this sensor. Then set the Method to
Readingsand the Frequency (hz) to0.333to capture data from the sensor device roughly once every 3 seconds.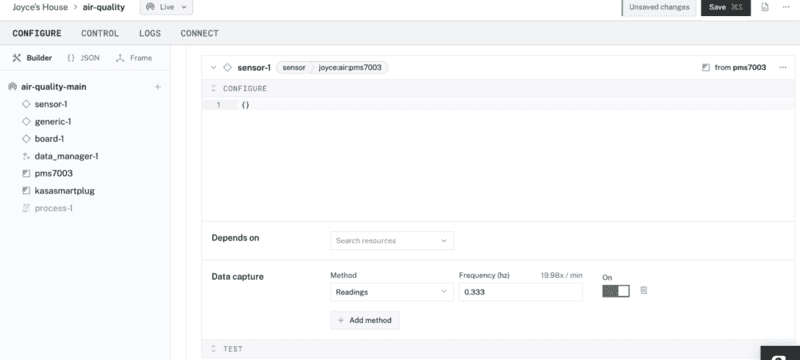
- Save the configuration changes.
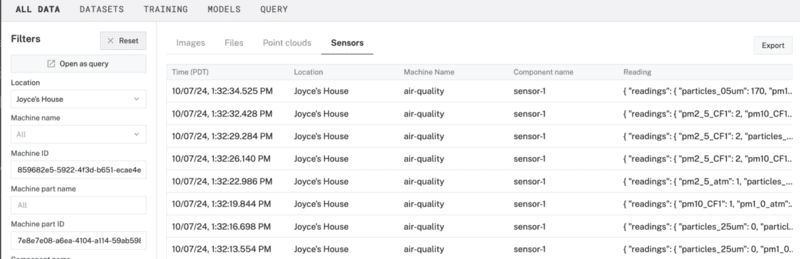
- Once your sensor starts capturing live readings, and syncing those readings to the Viam app, click on the options menu (...), and select View captured data.
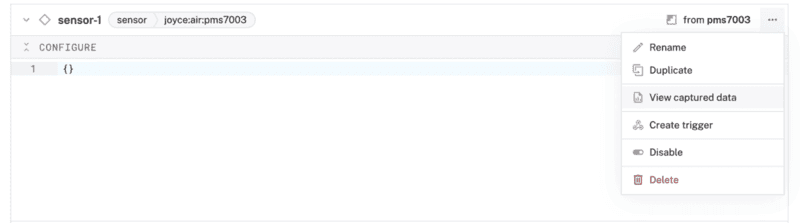
- Confirm the data is being captured properly.
When you sync captured data to Viam, that data is stored in the Viam organization's MongoDB Atlas Data Federation instance. Configuring a data query allows you to directly query your data using the Viam app or a compatible client (such as mongosh shell or MongoDB Compass), but also allows Grafana to access that data and visualize it.
Configure data query
To query data from third party tools, let's get the credentials you need to connect to the third party service.
- From your terminal window, authenticate with the Viam CLI using a personal access token. The following command will open a new browser window with a prompt to complete the authentication process.
viam login - Find your organization ID to create a database user allowing you to access your data. Make a note of the organization ID containing the active machine with the configured sensor component.
viam organizations list - Configure a new database user for the Viam organization's MongoDB Atlas Data Federation instance, which is where your machine's synced data is stored. Use your
org-idfrom the previous step and a new password for this database user. Your password must be 8 characters long with 1 uppercase and 1 numeric character.viam data database configure --org-id=<YOUR-ORGANIZATION-ID> --password=<NEW-DBUSER-PASSWORD> - Determine the connection URI for your organization's MongoDB Atlas Data Federation instance, again using your own
org-idfrom the previous steps.viam data database hostname --org-id=<YOUR-ORGANIZATION-ID># Example output MongoDB Atlas Data Federation instance hostname: data-federation-abcd1e2f-a1b2-3c45-de6f-ab123456c123-0z9yx.a.query.mongodb.net MongoDB Atlas Data Federation instance connection URI: mongodb://db-user-abcd1e2f-a1b2-3c45-de6f-ab123456c123:YOUR-PASSWORD-HERE@data-federation-abcd1e2f-a1b2-3c45-de6f-ab123456c123-0z9yx.a.query.mongodb.net/?ssl=true&authSource=admin - Make a note of the hostname returned by the previous command and the password you chose for that user, so that we can connect to the server and query your data in the next section.
With your machine capturing data and syncing it to Viam, and direct query of that data configured, you can now configure Grafana to access and visualize that data.
Add the MongoDB data source in Grafana
Let's set up the MongoDB data source in Grafana
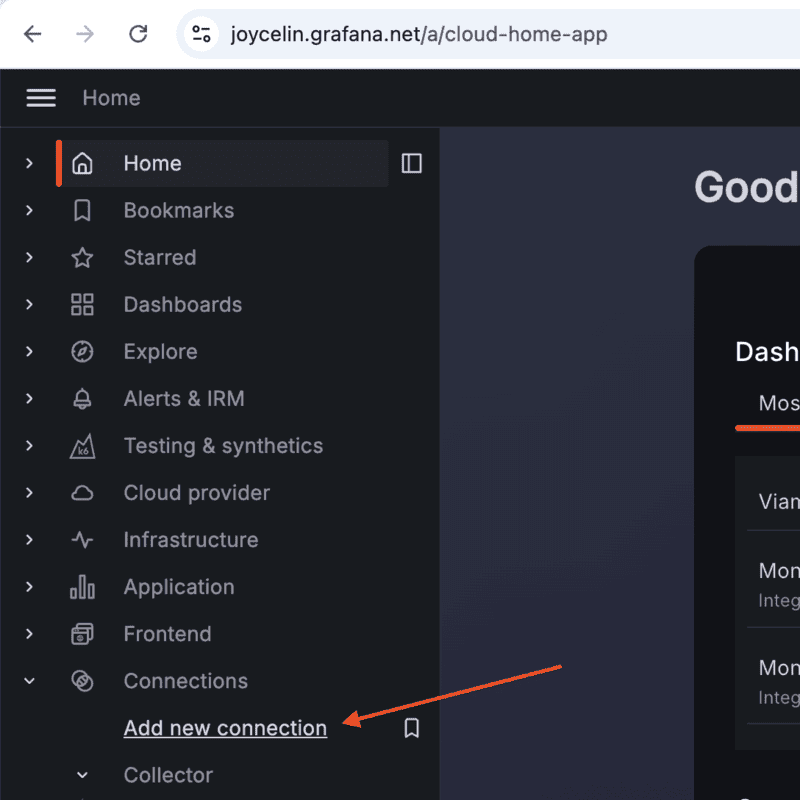
- To add the MongoDB data source, click Connections in the left-side menu of the Grafana web UI. Then click Add new connection.
- Enter
MongoDBin the search bar. Select MongoDB under the Data Source section. Be sure to install the MongoDB data source, not the integration.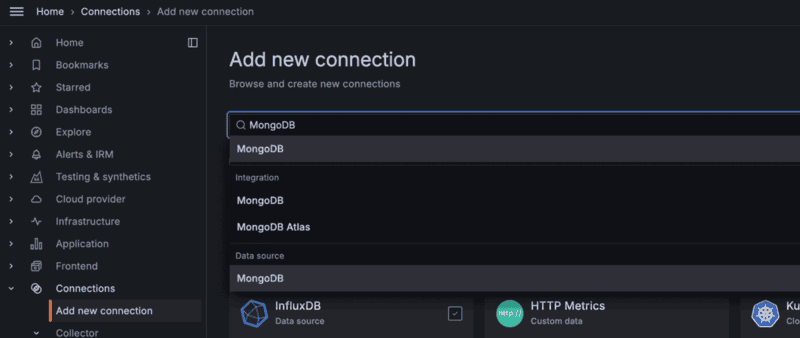
- Click Add new data source in the upper right. You will be taken to the Settings tab where you will set up your MongoDB configuration.
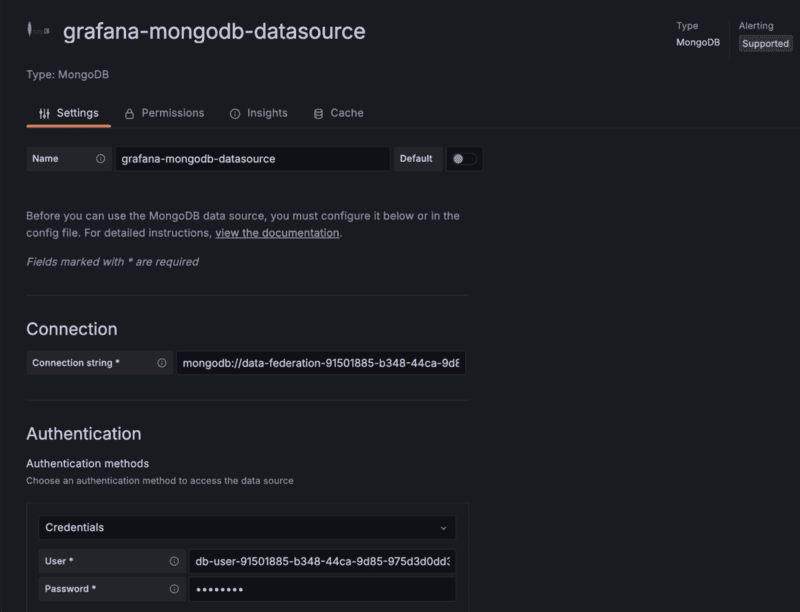
Configure the MongoDB data source
- Under the Name section, you can leave the default name. This is how you refer to the data source in panels and queries.
- Under the Connection section, add your Connection string, which contains some of the parameters required to connect to MongoDB. Replace
<MONGODB-ATLAS-DF-HOSTNAME>with your database hostname as configured with the previous steps, and replace<DATABASE-NAME>with the desired database name to query. For most use cases with Viam, this database name will besensorData.mongodb://<MONGODB-ATLAS-DF-HOSTNAME>/<DATABASE-NAME>?directConnection=true&authSource=admin&tls=true - Under the Authentication section, select Credentials from the dropdown.
- Within the User field, enter the following username, substituting your organization ID as determined earlier, for
<YOUR-ORG-ID>.db-user-<YOUR-ORG-ID> - Under the Password field, enter the password you provided earlier.
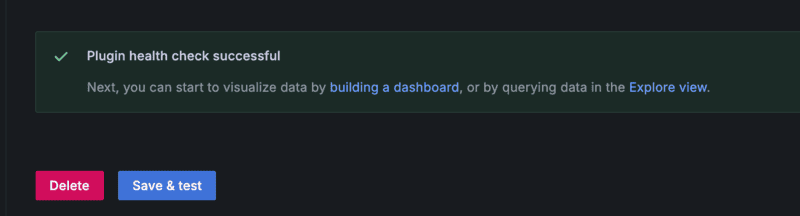
- At the bottom of the Settings page, click Save & test to verify the plugin has been set up properly.
With your data connection established, you can then build dashboards that provide insight into your data.
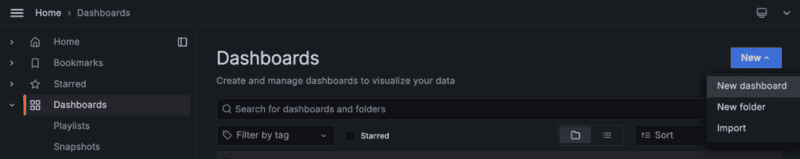
Create a new dashboard
- To create a new Grafana dashboard on Grafana Cloud, click Dashboards in the left-side menu of the Grafana web UI. Then click New, and select New dashboard.
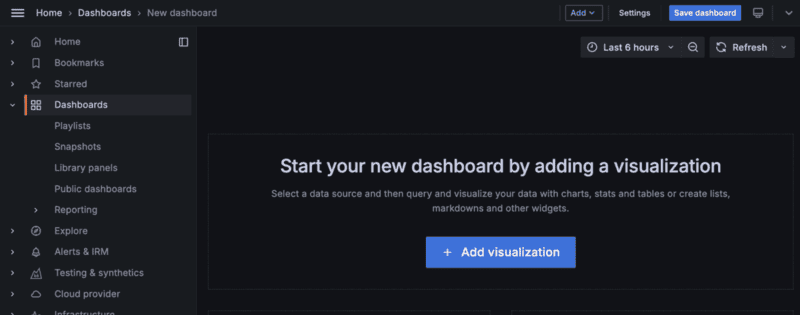
- Start your new dashboard by adding a New visualization. Click + Add visualization.
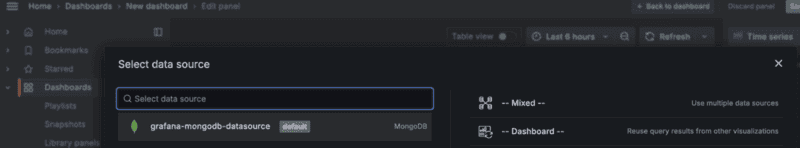
- Select the name of the data source that you just configured.
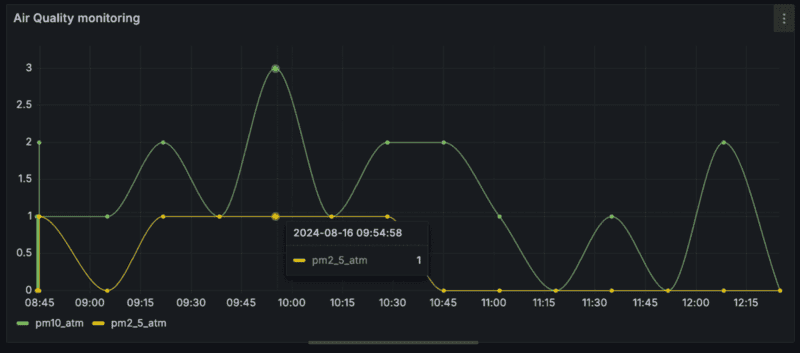
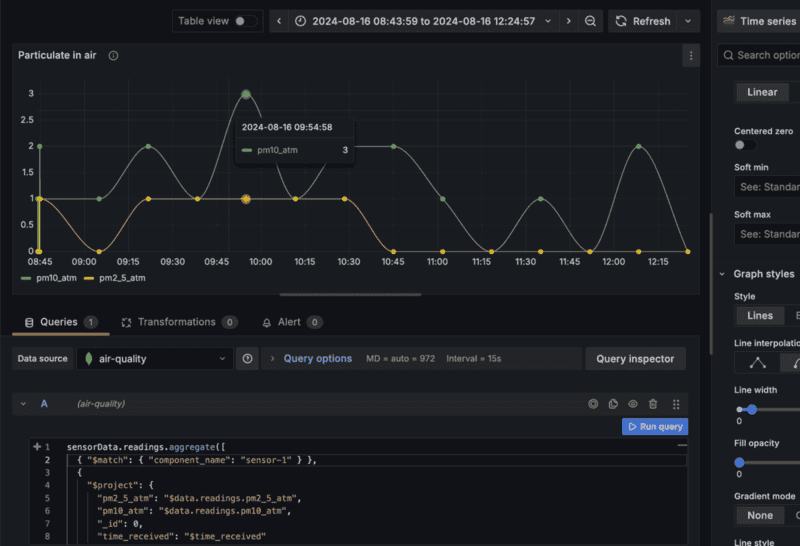
- Write or construct a query in the query language of your data source, either SQL or MQL. The following MQL query searches the
sensorDatadatabase andreadingscollection, and gets readings from an air quality sensor calledsensor-1, filtering on fine particulate matter with a diameter of 2.5 or 10 micrometers.sensorData.readings.aggregate([ { $match: { component_name: "sensor-1" } }, { $project: { pm2_5_atm: "$data.readings.pm2_5_atm", pm10_atm: "$data.readings.pm10_atm", _id: 0, time_received: "$time_received" } } ]) - Optional: If your datasets contains a lof of data due to high frequency data capture or you want to query over long date/time ranges, consider aggregating the data on the data backend using a bucket query as follows:
sensorData.readings.aggregate([ { "$match": { "time_requested": { "$gt": $__timeFrom, "$lte": $__timeTo } }}, { "$group": { "_id": { "$subtract": [ { "$subtract": ["$time_requested", ISODate("1970-01-01")]}, { "$mod": [ { "$subtract": ["$time_requested", ISODate("1970-01-01")] }, $__interval_ms ]} ] }, "current": { "$avg": "$data.readings.Current" }, "voltage": { "$avg": "$data.readings.Voltage" }, "speed": { "$avg": "$data.readings.Speed" } } }]) - Click the Run query button, and confirm the time series data displays as you want it to on the graph above.
- Continue editing your query, or add new queries, and then Save dashboard when you're done.
Grafana supports the ability to directly query and transform your data within a dashboard to generate more granular visualizations of specific data. You can query your captured data within a Grafana dashboard using either SQL or MQL. See the guide on querying sensor data or the guide on visualizing your data for more information.
What You Learned
- how to capture sensor data with Viam
- how to set up data management with Viam
- how to visualize sensor data in Viam with a third-party tool, such as Grafana
- how to use the MongoDB plugin with Viam and Grafana
- how to create a Grafana dashboard using the MongoDB data source
Related Resources
- Visualize sensor data in Grafana demo video
- Learn how to query data with third-party tools
- Automate air filtration with air quality sensors codelab
- Monitor Air Quality with a Fleet of Sensors tutorial