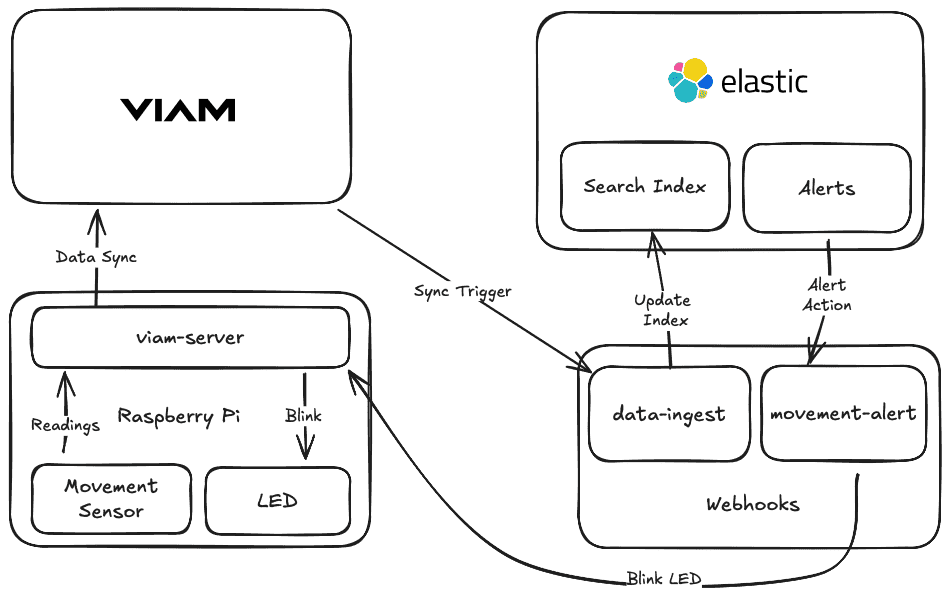
Gathering sensor data starts out simple but over time it can be overwhelming to sift through all that information, especially as more and more sensors come online. If you've worked on a comprehensive web service in the past, you might already know about Elasticsearch and the rest of the ELK stack for indexing and analyzing data from any source, including sensors connected to Viam machines! One neat feature of the ELK stack is configurable alerting rules and actions that can be used to automate notifications or even affect the physical world using one of Viam's SDKs.
In this codelab, you'll learn how to continually index sensor data from Viam into Elasticsearch and display an alert in the real world.
Prerequisites
- A computer with MacOS, Windows, or Linux to flash your Raspberry Pi and configure the device's components using the Viam app
- Hardware and supplies:
- 1 - Raspberry Pi 5
- Follow the Raspberry Pi setup guide to make sure your Pi is flashed with a Viam-compatible operating system, and that you are able to SSH into it.
- 1 microSD card to use with your Pi
- 1 power supply for your Pi
- 1 MPU6050 GY-521 movement sensor module
- 1 LED of any color
- 1 solderless breadboard
- 6 jumper wires to connect the sensor to the Pi
- 1 - Raspberry Pi 5
What You'll Need
- All the hardware components listed in prerequisites.
- Python3 installed on your computer
- VS Code installed, or another similar code editor of your choice.
- A zrok account and enabled environment.
- Or another tunneling utility like ngrok or Cloudflare Tunnel
- An Elastic stack deployment
- Sign up for a free Viam account, and then sign in to the Viam app
What You'll Learn
- how to wire a movement sensor and LED to a Raspberry Pi
- how to capture sensor data in Viam
- how to use webhooks as an ETL process between Viam and Elastic
- how to use webhooks to blink an LED based on an Elastic alert
What You'll Build
- a production-ready sensor data monitoring and automation system built around Viam and Elastic
The Raspberry Pi boots from a microSD card. You need to install Raspberry Pi OS on an SD card that you will use with your Pi. For more details about alternative methods of setting up your Raspberry Pi, refer to the Viam docs.
Install Raspberry Pi OS
- Connect the microSD card to your computer.
- Download the Raspberry Pi Imager and launch it.
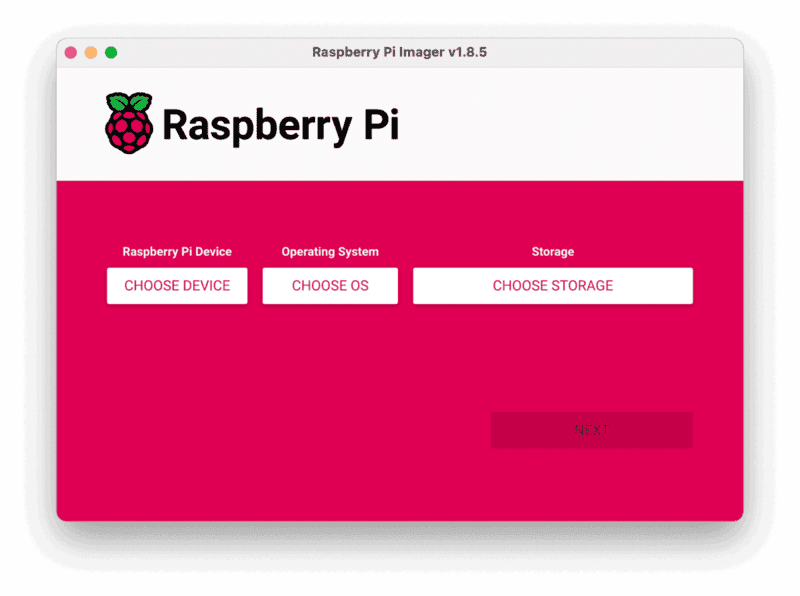
- Click CHOOSE DEVICE. Select your model of Pi, which is the Raspberry Pi 5.
- Click CHOOSE OS. Select Raspberry Pi OS (other) then Raspberry Pi OS Lite (64-bit) from the menu.
- Click CHOOSE STORAGE. From the list of devices, select the SD card you intend to use in your Raspberry Pi.
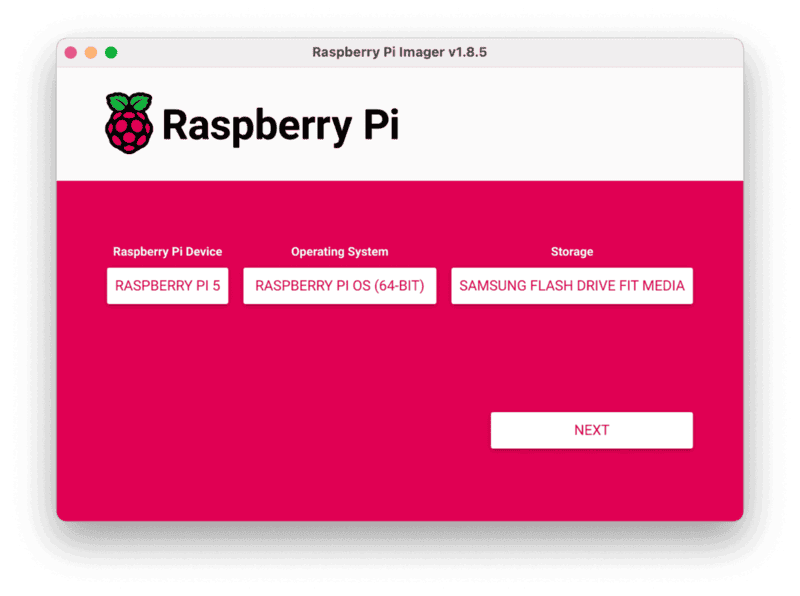
- Configure your Raspberry Pi for remote access. Click Next. When prompted to apply OS customization settings, select EDIT SETTINGS.
- Check Set hostname and enter the name you would like to access the Pi by in that field, for example,
monitor. - Select the checkbox for Set username and password and set a username (for example, your first name) that you will use to log into the Pi. If you skip this step, the default username will be
pi(not recommended for security reasons). And specify a password. - Connect your Pi to Wi-Fi so that you can run
viam-serverwirelessly. Check Configure wireless LAN and enter your wireless network credentials. SSID (short for Service Set Identifier) is your Wi-Fi network name, and password is the network password. Change the sectionWireless LAN countryto where your router is currently being operated.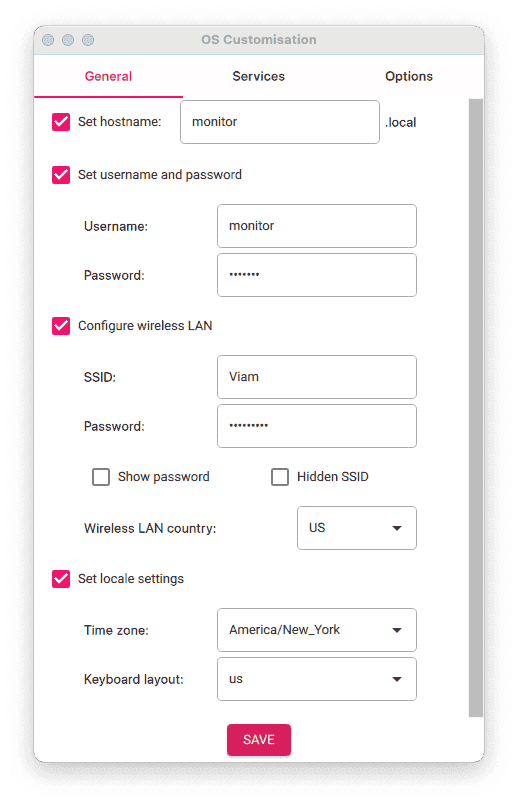
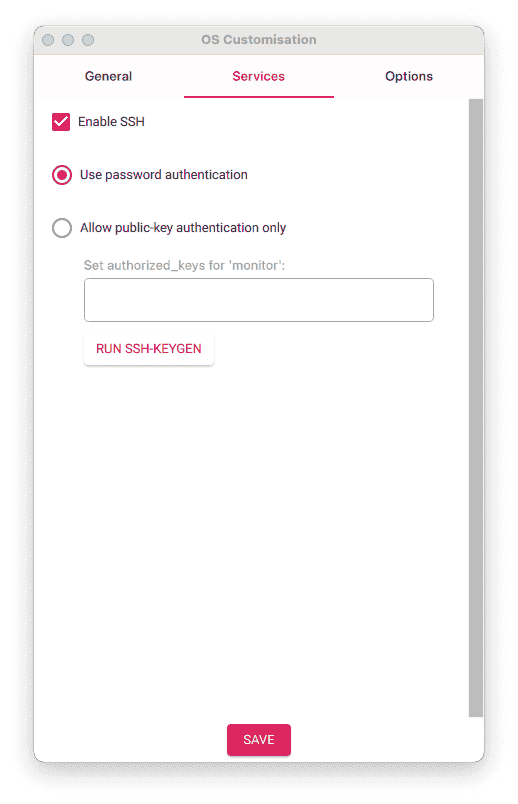
- Select the SERVICES tab, check Enable SSH, and select Use password authentication.
- Save your updates, and confirm
YESto apply OS customization settings. ConfirmYESto erase data on the SD card. You may also be prompted by your operating system to enter an administrator password. After granting permissions to the Imager, it will begin writing and then verifying the Linux installation to the SD card. - Remove the SD card from your computer when the installation is complete.
Connect with SSH
- Place the SD card into your Raspberry Pi and boot the Pi by plugging it in to an outlet. A red LED will turn on to indicate that the Pi is connected to power.
- Once the Pi is started, connect to it with SSH. From a command line terminal window, enter the following command. The text in <> should be replaced (including the < and > symbols themselves) with the user and hostname you configured when you set up your Pi.
ssh <USERNAME>@<HOSTNAME>.local - If you are prompted "Are you sure you want to continue connecting?", type "yes" and hit enter. Then, enter the password for your username. You should be greeted by a login message and a command prompt.
- Update your Raspberry Pi to ensure all the latest packages are installed
sudo apt update
sudo apt upgrade
Enable communication protocols
- Launch the Pi configuration tool by running the following command
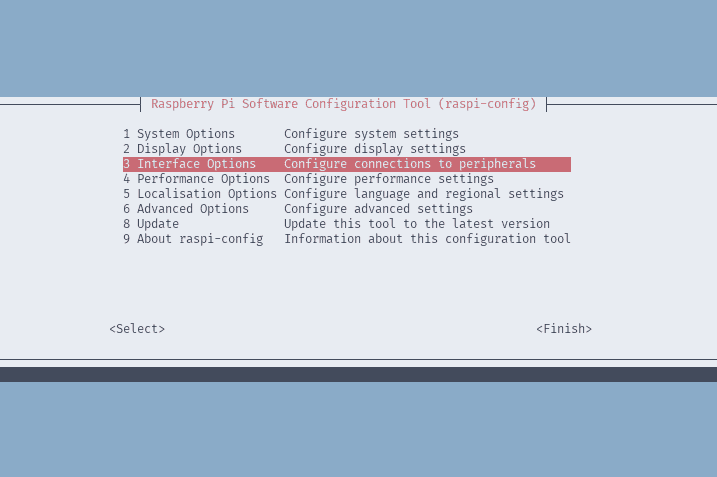
sudo raspi-config - Use your keyboard to select "Interface Options", and press return.
- Enable the relevant protocols to support our hardware. Since you are using a sensor that communicates over I2C, enable I2C.
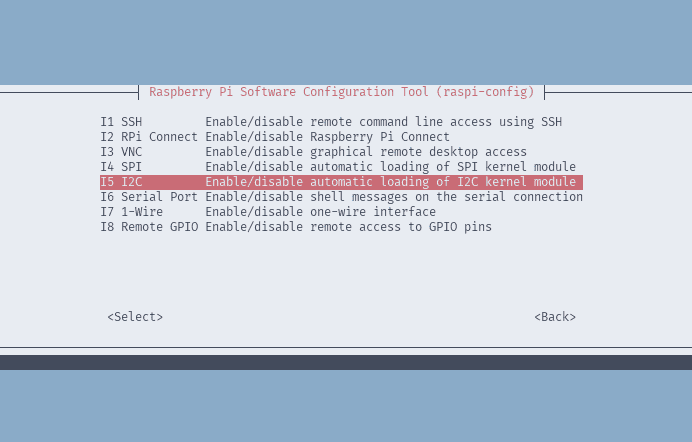
- Confirm the options to enable the I2C interface. And reboot the Pi when you're finished.
sudo reboot
Movement sensor
The MPU6050 movement sensor measures angular velocity (X,Y, and Z axis), linear acceleration (X,Y, and Z axis), and ambient temperature (Celsius), all from a single component. This will give you plenty of data work with when integrating with Elastic. It communicates over I2C using 1 wire for data, 1 for the clock to keep messages in sync, 1 for power, and 1 for ground.
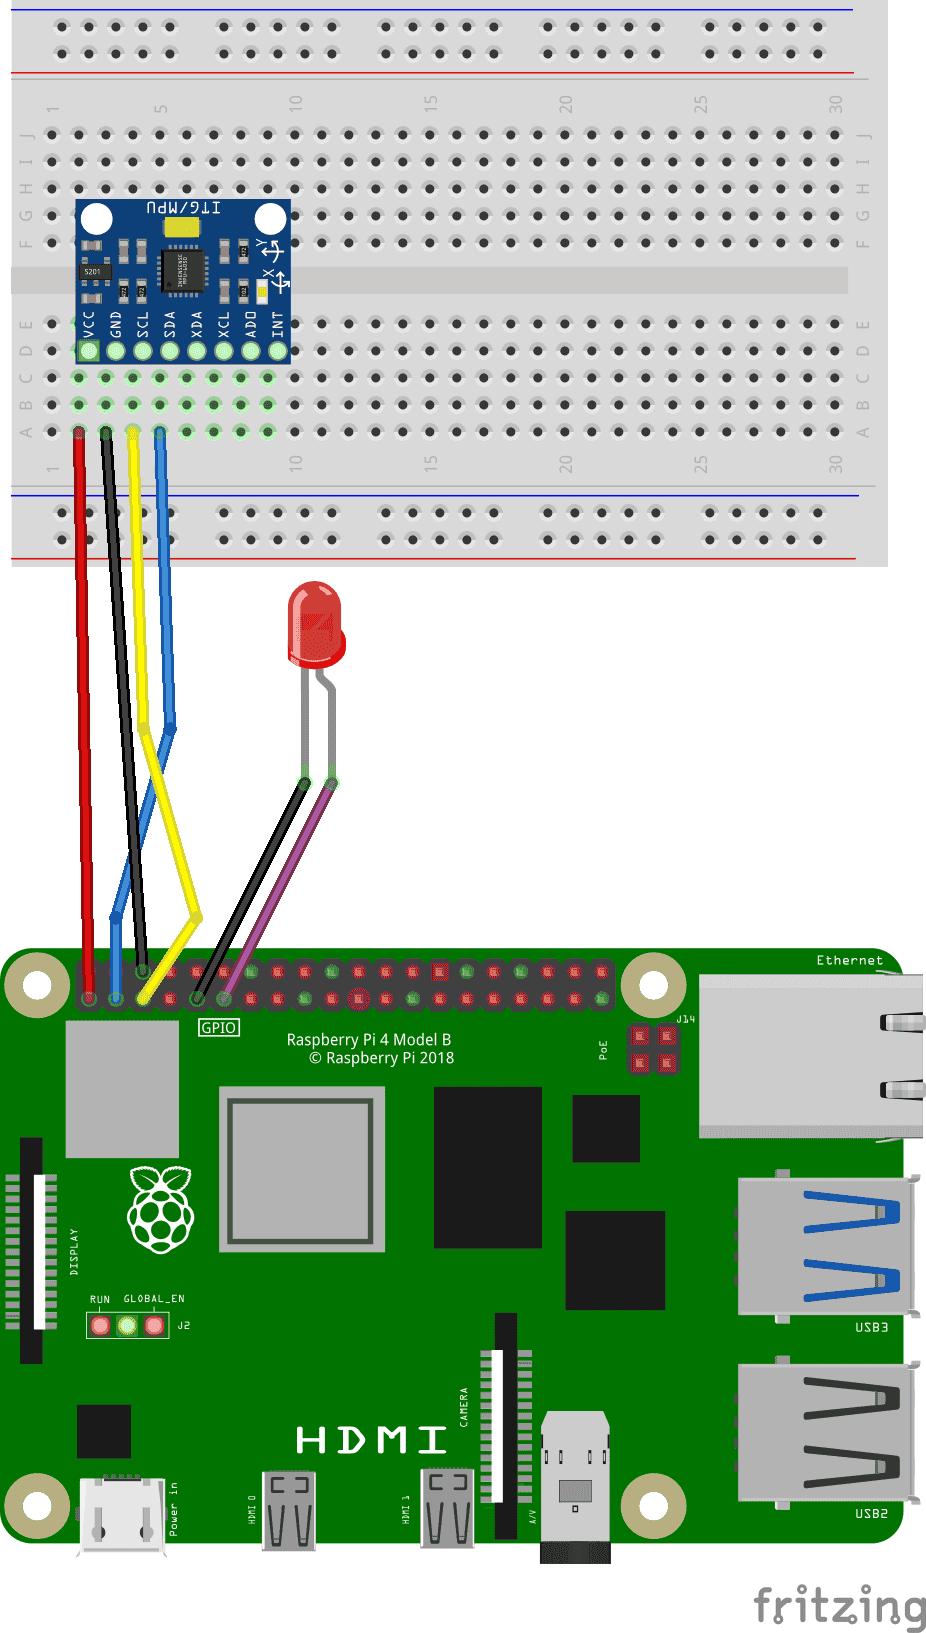
Refer to the following wiring diagram to connect the Raspberry Pi to the MPU6050 movement sensor component.
- Pin 1 (3V) to VCC (Power)
- Pin 3 (SDA) to SDA (Data)
- Pin 5 (SCL) to SCL (Clock)
- Pin 6 (Ground) to GND (Ground)
LED
The LED will be used to display the alert from the Elastic rule notification. It needs a wire to a general purpose input/ouput (GPIO) pin and a wire to ground to toggle it on and off.
Refer to the following wiring diagram to connect the Raspberry Pi to the LED.
- Pin 9 (Ground) to the shorter leg on the LED
- Pin 11 (GPIO 17) to the longer led on the LED
Powering the Pi
To power the Raspberry Pi, you can use the USB cord from earlier to continue providing power from your computer, or use a separate USB power supply.
Create your machine
- In the Viam app under the LOCATIONS tab, create a machine by typing in a name and clicking Add machine.

- Click View setup instructions.

- To install
viam-serveron the Raspberry Pi device that you want to use to communicate with and control your webcam, select theLinux / Aarch64platform for the Raspberry Pi, and leave your installation method asviam-agent.
- Use the
viam-agentto download and installviam-serveron your Raspberry Pi. Follow the instructions to run the command provided in the setup instructions from the SSH prompt of your Raspberry Pi.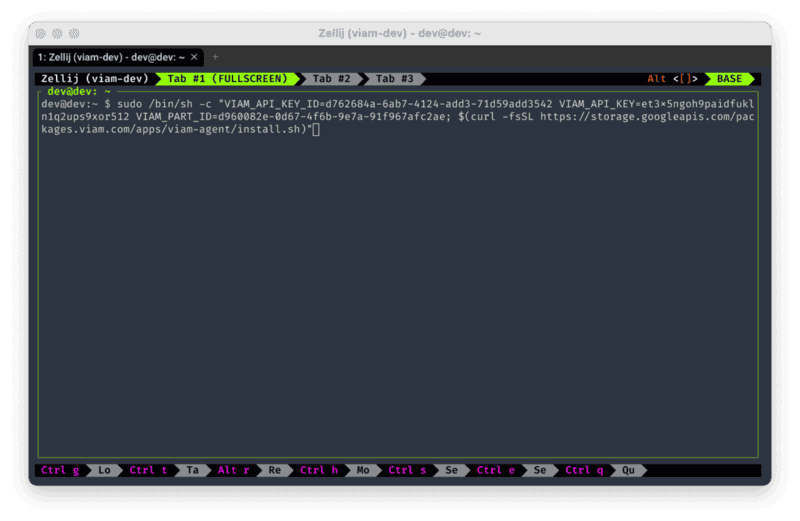
- The setup page will indicate when the machine is successfully connected.

Add your Raspberry Pi
- In the Viam app, find the CONFIGURE tab. It's time to configure your hardware.
- Click the + icon in the left-hand menu and select Component.
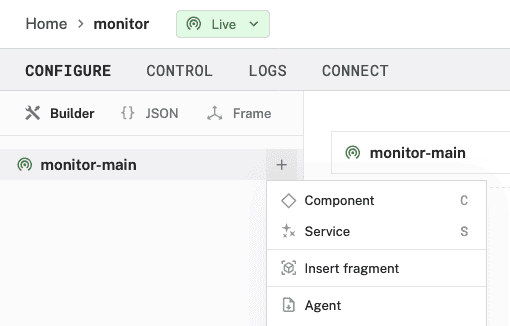
- Select
board, and find thepi5module. This adds the module for working with the Raspberry Pi 5's GPIO pins. Leave the default nameboard-1for now.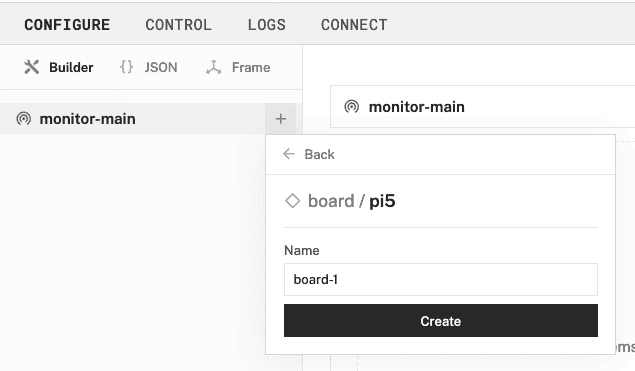
- Notice adding this module adds the board hardware component called
board-1. The collapsible card on the right corresponds to the part listed in the left sidebar.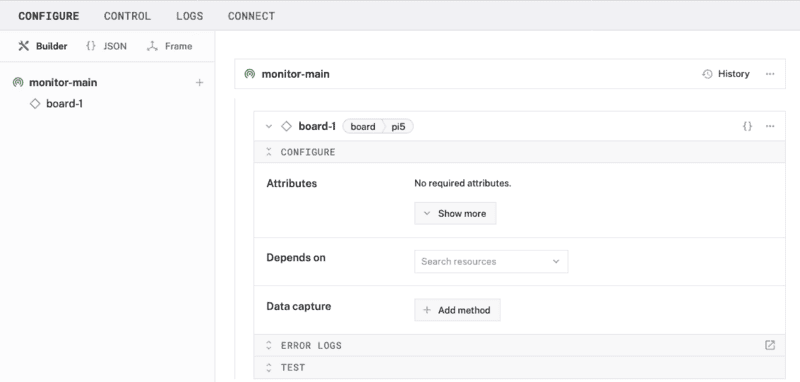
- Click Save in the top right to save and apply your configuration changes.
Add your movement sensor
- In the Viam app, click the + icon and select Component. Select
movement sensor, find thegyro-mpu6050module, and click Add module. This module provides the movement sensor model that supports the specific hardware we are using for this tutorial. Leave the default namemovement_sensor-1for now.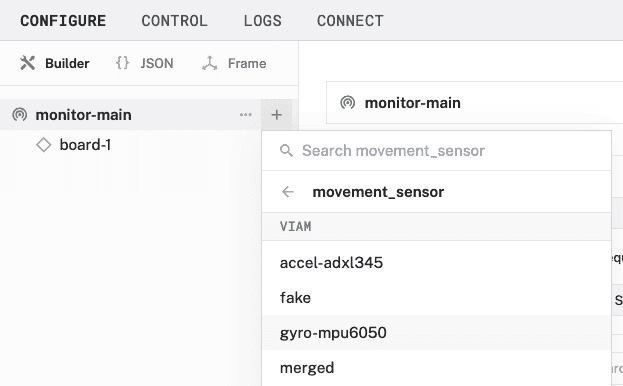
- Notice adding this module adds the sensor hardware component called
movement_sensor-1.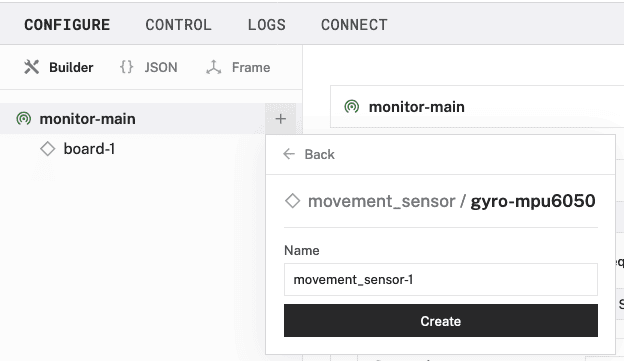
- In the
movement_sensor-1panel, fill in the "i2c_bus" field under the Attributes section with the number "1"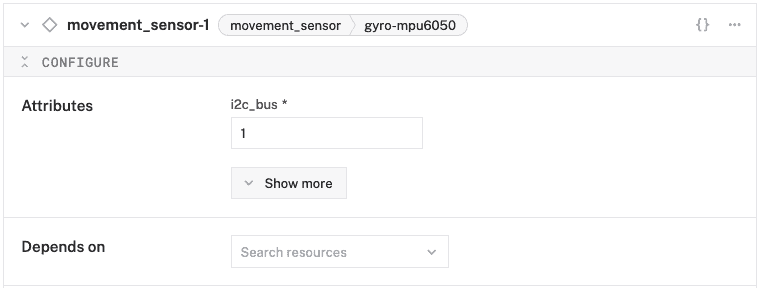
- Save your updates.
Add the data manager
- In the Viam app, click the + icon in the left-hand menu and select Service, and then
data management.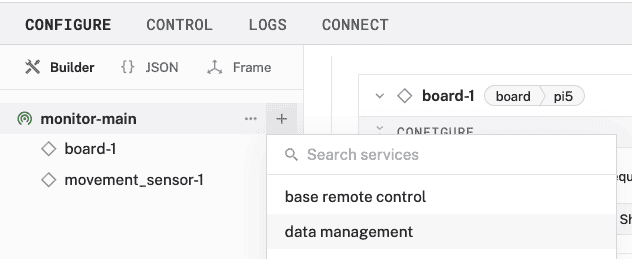
- Create a new Data Management service called
data_manager-1.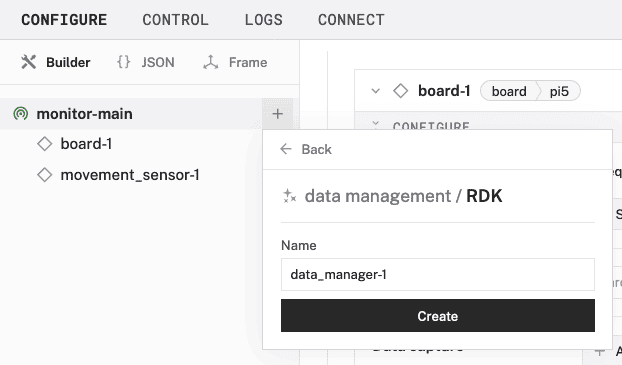
- Notice adding this service adds the data manager service called
data_manager-1. It will default to the "Capturing" and "Syncing" toggles as enabled. Leave them that way.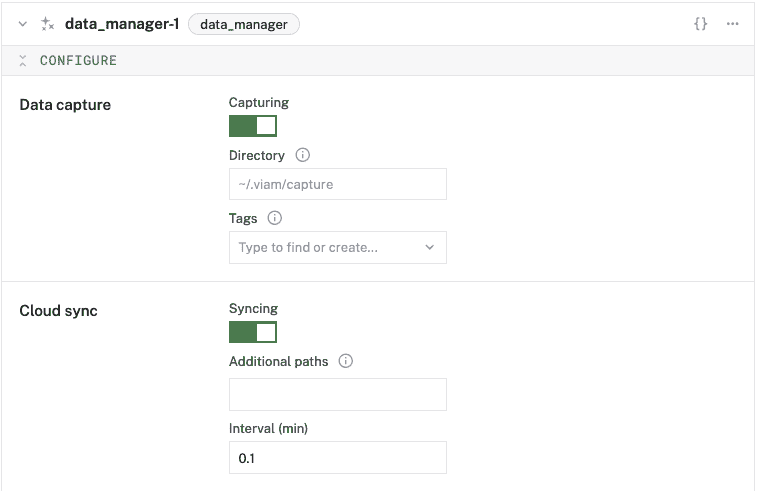
- Save your updates.
Capture movement data
- In the
movement_sensor-1panel, click the "+ Add method" button under the Data capture section.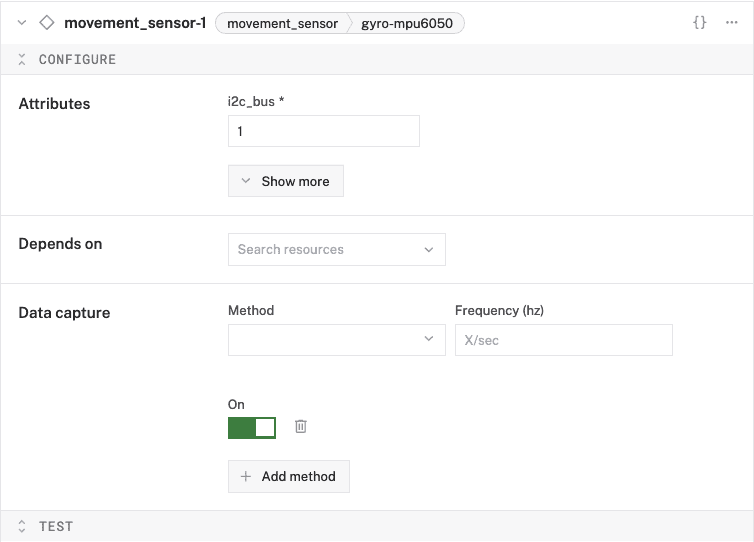
- For the "Method" dropdown, select "Readings", enter "0.5" in the "Frequency (hz)" field.
- Make sure the data capture toggle is "On".

- Save your updates.
This step assumes some knowledge of the Elastic console used to manage Elasticsearch, Kibana, and other services provided by the platform.
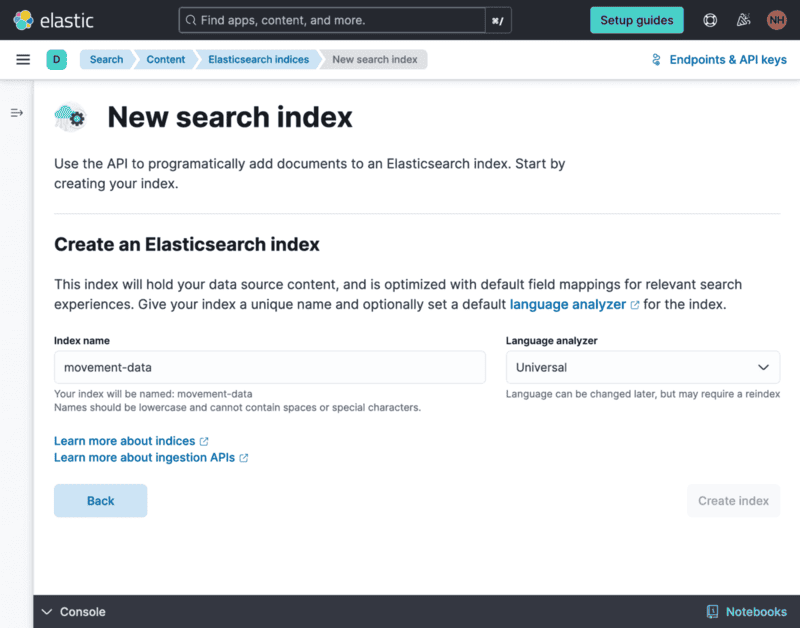
- In the Elastic app, navigate to the Search -> Content dashboard, which should default to displaying Elasticsearch indices. Click the "+ Create a new index" button.
- Enter a name for the index, like "movement-data", under the "Index name" field. Keep the "Language analyzer" as "Universal".
- Click "Create index" to complete the creation of the index.
Generate an API key
On the Overview tab of the newly created index, there are instructions for getting started with the Elastic API.
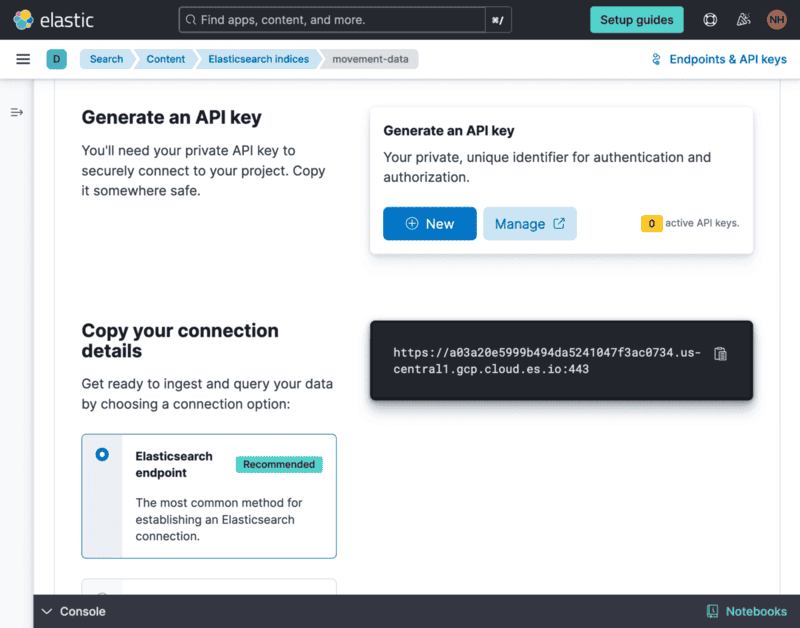
- Scroll down to the Generate an API key section of the page. Click "+ New".
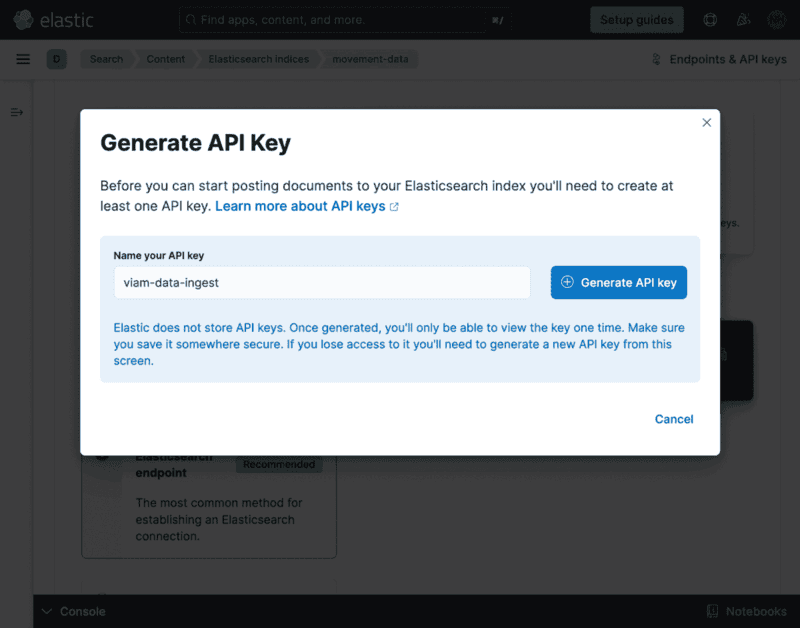
- Name your API key "viam-data-ingest" and click "+ Generate API key".
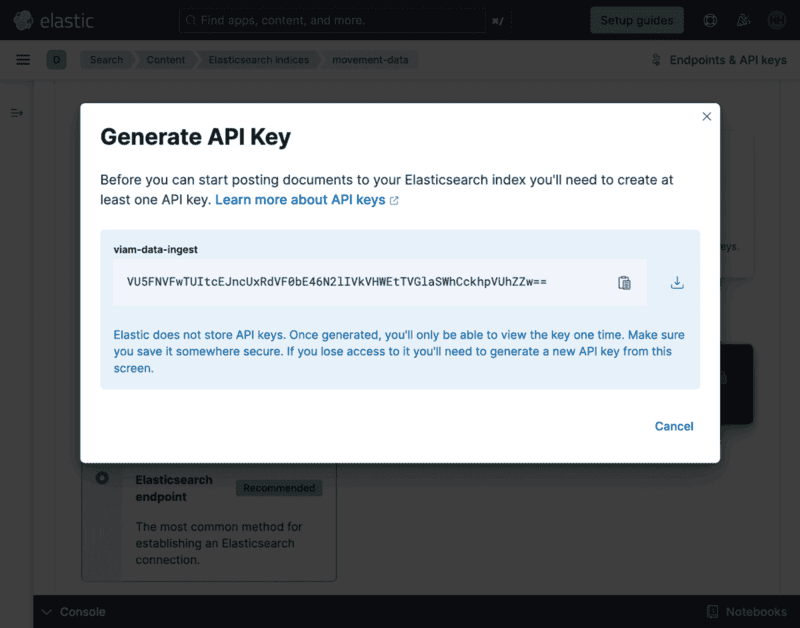
- Copy or download the generated API key and store it in a secure place, like a password or secrets manager, for use in the next section. Click "Cancel" to close the modal.
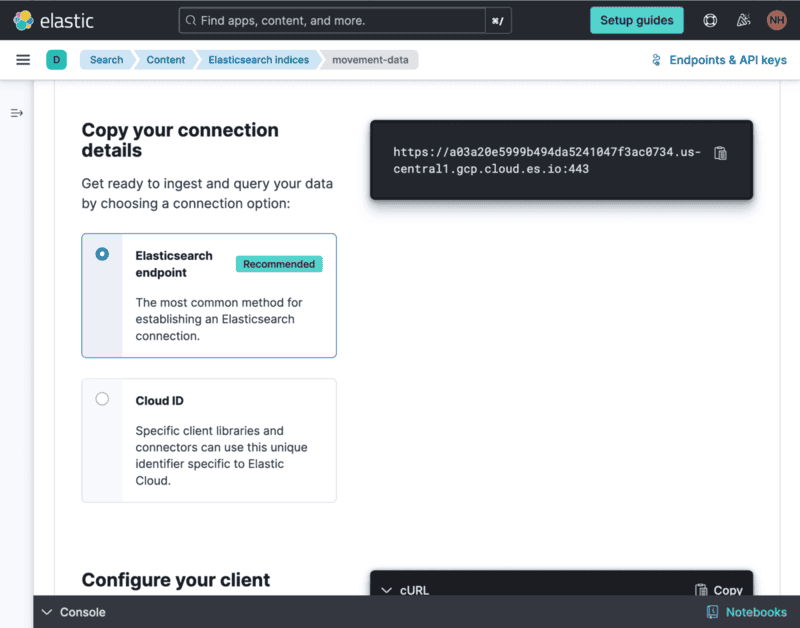
- Back on the index overview page, scroll to Copy your connection details and copy the endpoint URL displayed to the right for use in the next section.
To continually update the Elasticsearch index with sensor data, we're going to create a serverless function to be used as a trigger whenever new data is synced from the machine.
The full example code is in the project GitHub repository.
Create a function
The function is authored in Python using the Functions Framework, which will make it easy to run locally and deploy to Google Cloud Functions when you're ready.
- In your terminal, clone the repository to your local development environment.
git clone https://github.com/viam-devrel/physical-world-monitoring.git
- Change directories into the newly-cloned project.
cd physical-world-monitoring
- Install the uv Python project manager On macOS and Linux
curl -LsSf https://astral.sh/uv/install.sh | sh
On Windowspowershell -c "irm https://astral.sh/uv/install.ps1 | iex"
- Install the project dependencies.
uv pip install -r pyproject.toml
- Make a copy of the
.env.examplefile called.envand fill out the necessary environment variables for the function. Set theELASTIC_API_KEY_IDto "viam-data-ingest" and set the other variables to their respective values from the Elasticsearch index configuration earlier.ELASTIC_API_KEY="" ELASTIC_API_KEY_ID="" ELASTIC_CONNECTION_ENDPOINT="" - Run the function server locally:
uv run functions-framework --source ./cloud-functions/ingest-sensor-data/main.py --target ingest_data --debug
This will start a Flask Python server at http://localhost:8080.
Expose the function to the public Internet
To test out the function without going through the process of deploying to a production cloud service, we will create a tunnel from the public Internet to the local server using zrok. This step assumes you already have zrok installed and your environment enabled to start sharing the local server.
- In a new terminal window or tab, run the command to create a public proxy:
zrok share public localhost:8080
- The public URL will be displayed along with any request logs that come in when the webhook is triggered.

Configure a trigger
The data sync trigger will send a request to the webhook whenever data from the sensor is synced to Viam Data in the cloud. That request will include that new data in the body.
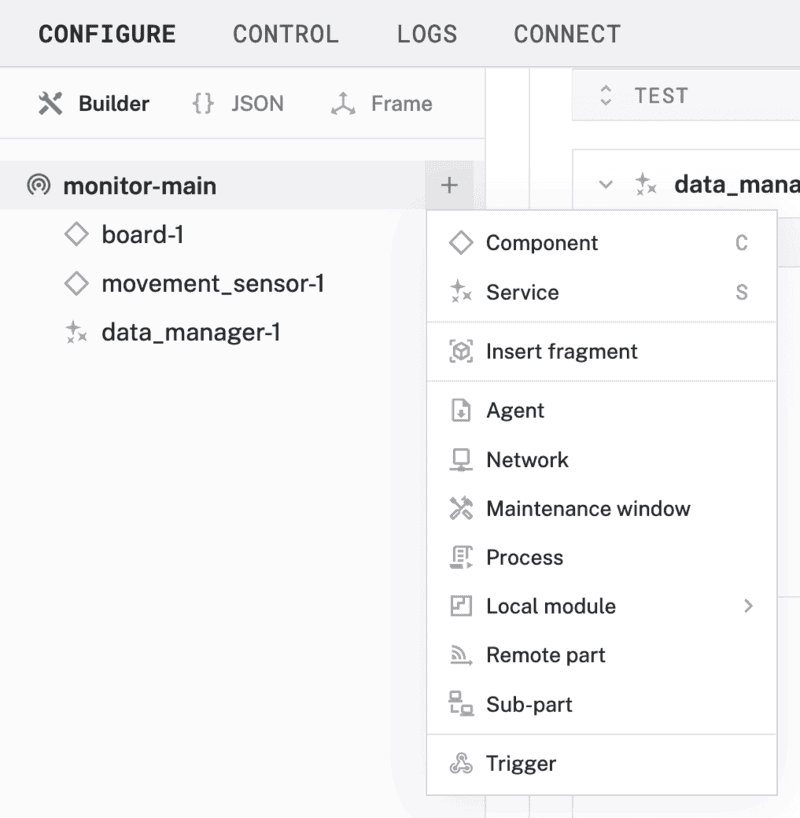
- In the Viam app, click the + icon in the left-hand menu and select Trigger.
- Keep the name as
trigger-1and click "Create".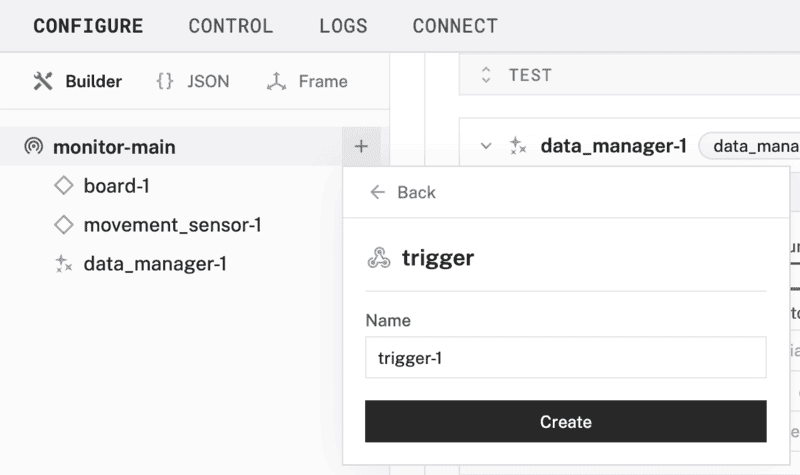
- Notice adding this module adds a new panel called
trigger-1.
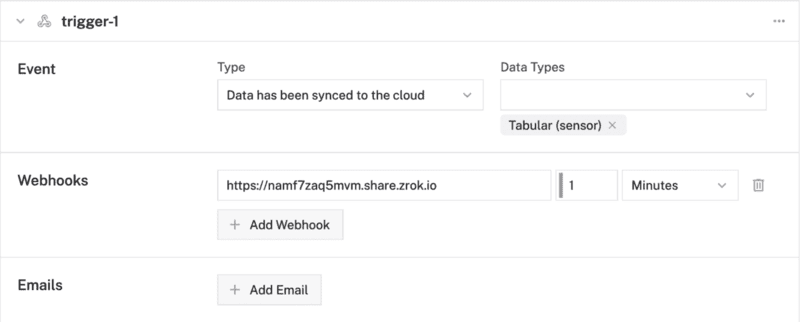
- In the Event section of the panel, select "Data has been synced to the cloud" as the Type and "Tabular (sensor)" from the list of Data Types.
- In the Webhooks section, click "+ Add Webhook" then enter the public URL from zrok in the first field and keep the default 1 minute between notifications.
- Click Save in the top right to save and apply your configuration changes.
You will then see requests start to come through the zrok logs: 
The function server will also display logs while the request is being processed: 
In order to react to an alert based on the sensor data being monitored in Elastic, we will create another serverless function to handle the event and blink the LED connected to the Raspberry Pi.
The full example code is in the project Github repository.
Create a function
The function is authored in Python using the Functions Framework, which will make it easy to run locally and deploy to Google Cloud Functions when you're ready.
- Within the "physical-world-monitoring" project directory that you cloned earlier, update the
.envfile by filling out the necessary environment variables for the function. The Viam API key, ID, and machine address can be found in the "Control" tab of your machine in the Viam app. ThePIN_NAMEis the physical GPIO pin number for the LED connected to the Raspberry Pi and theBOARD_NAMEis the board component name in the machine configuration.VIAM_API_KEY="" VIAM_API_KEY_ID="" MACHINE_ADDRESS="" PIN_NAME="11" BOARD_NAME="board-1" - Run the function server locally:
uv run functions-framework --source ./cloud-functions/movement-alert/main.py --target alert_movement --debug --port 8081
This will start a Flask Python server at http://localhost:8081 to avoid conflicting with the other function server.
Expose the function to the public Internet
To test out the function without going through the process of deploying to a production cloud service, we will create a tunnel from the public Internet to the local server using zrok. This step assumes you already have zrok installed and your environment enabled to start sharing the local server.
- In a new terminal window or tab, run the command to create a public proxy:
zrok share public localhost:8081
- The public URL will be displayed along with any request logs that come in when the webhook is triggered.

You can test the webhook using cURL, replacing the URL with the one displayed by zrok in your terminal:
curl -X POST -d '{"hello":"world"}' https://bnqm830gaw6k.share.zrok.io
The data being sent doesn't matter at this point, as long as it is a valid JSON string.
This step assumes some knowledge of the Elastic console used to manage Elasticsearch, Kibana, and other services provided by the platform.
- In the Elastic app, navigate to the Observability -> Alerts dashboard. Click on "Manage Rules".
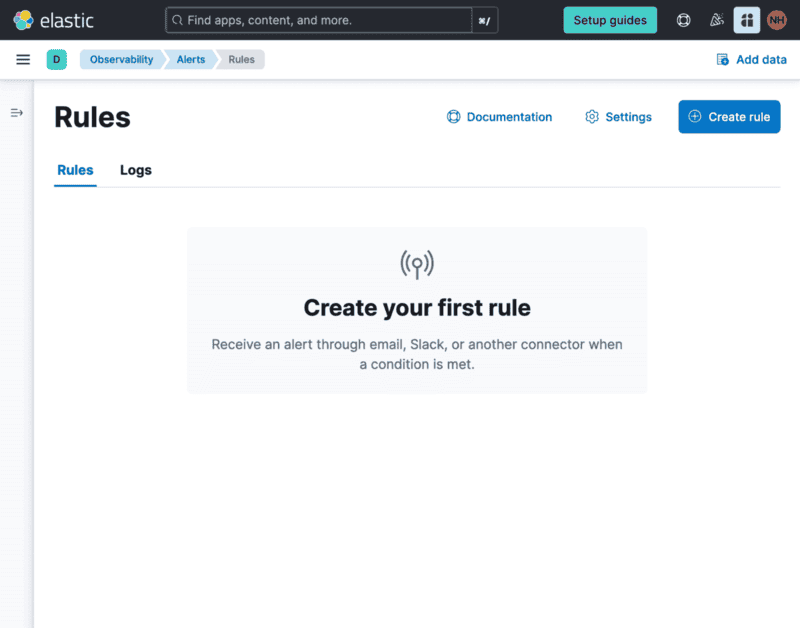
- Click "Create rule" and select "Custom threshold".
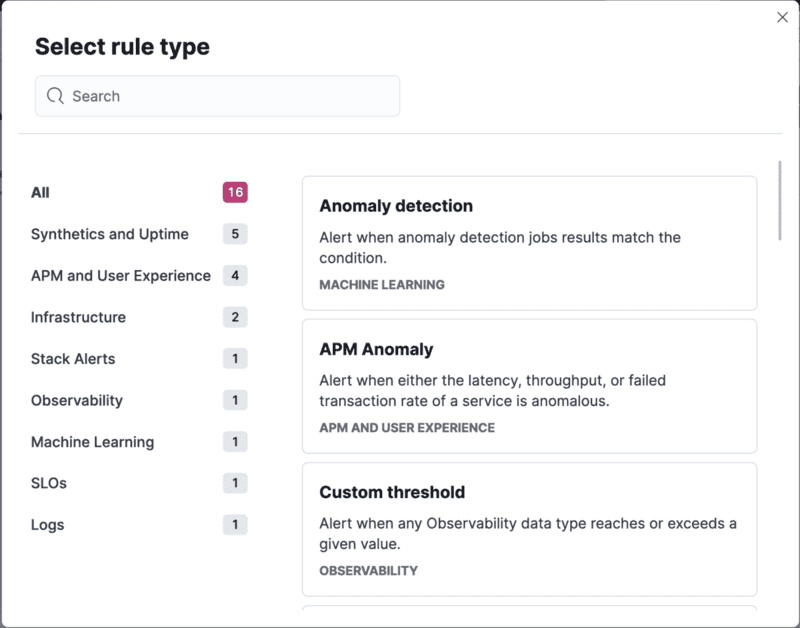
- Enter "movement-threshold" for the name of the rule.
- Scroll to the Custom threshold section, click on the "DATA VIEW" field followed by "Create a new data view".
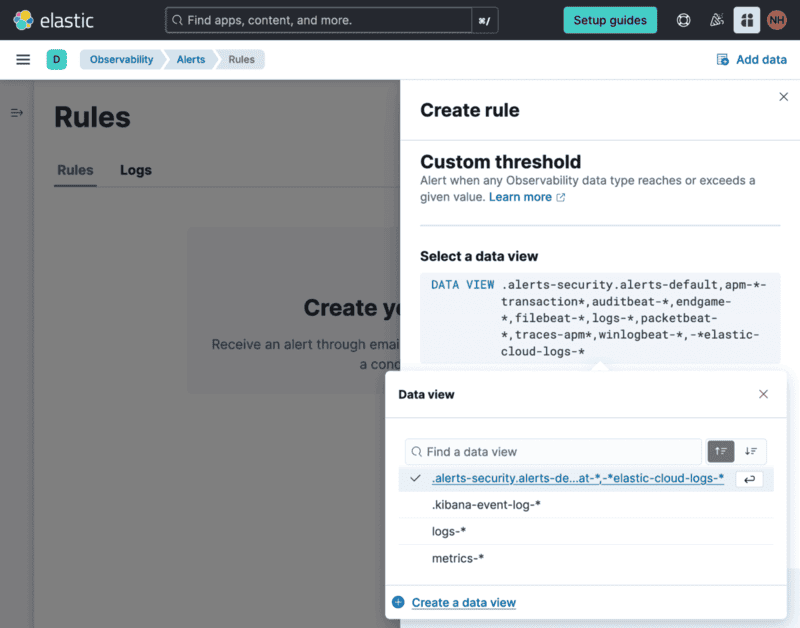
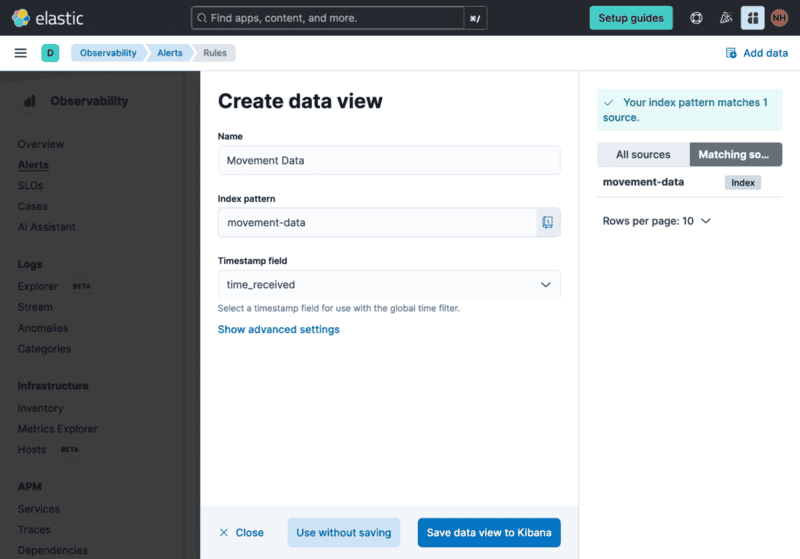
- Enter "Movement Data" into the name of the view, then "movement-data" as the index pattern, followed by selecting "time_received" for the timestamp field.
- Click "Save data view to Kibana" to complete the creation of the data view
- In the Define query filter field, enter a custom query to trigger the alert based on the data you've gathered, for example:
angular_velocity.y < -1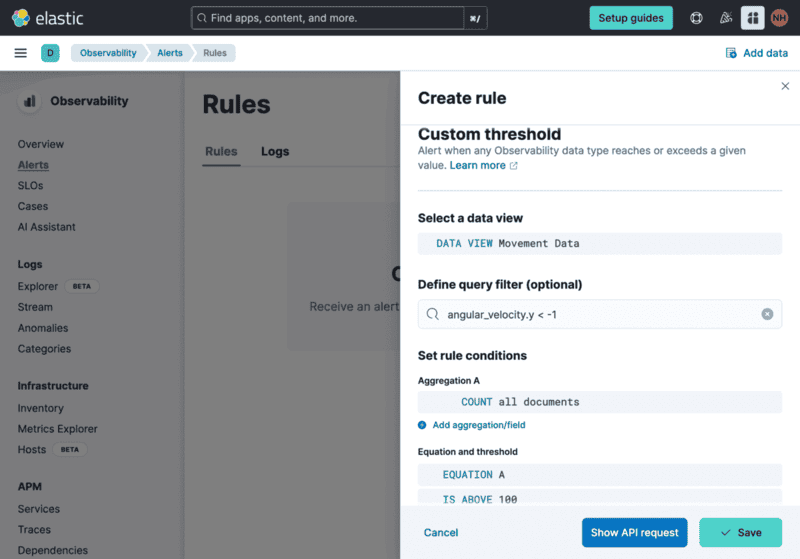
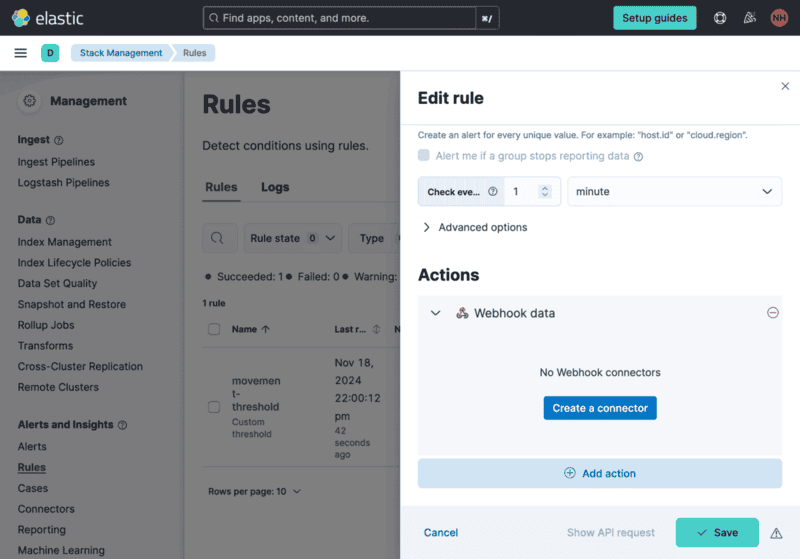
- Scroll down to Actions and select the Webhook connector type, then click the "Create a connector" button.
- Name the connector "Machine Alert", enter the public URL for your running webhook function, and select "None" for the authentication.
- Click "Save" to complete creating the connector.
- In the body field of the "Machine Alert" action, add some data to include in the request to the webhook.
This can be used in conditional logic added later to change the effect of the webhook based on that data.{ "alert_id": "{{alert.id}}", "alerted_at": "{{context.timestamp}}" }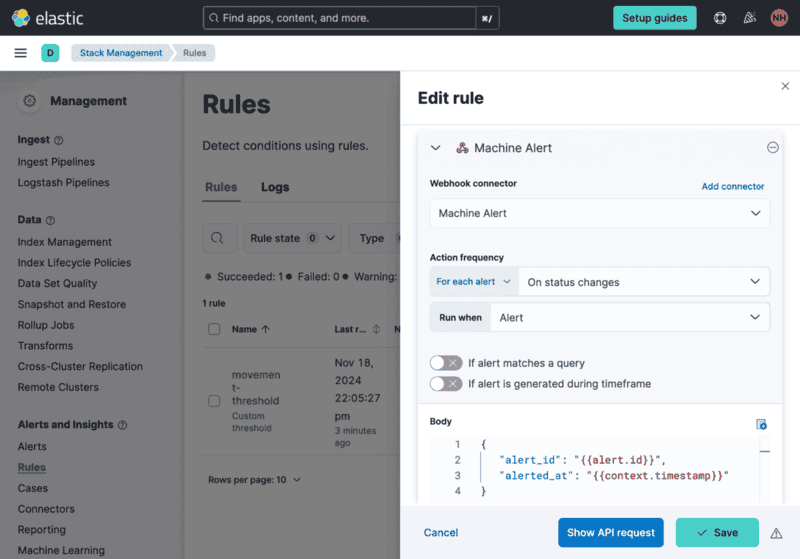
- Click "Save" to complete creating the rule.
Test the connector
- To test the webhook connector without waiting for the rule to trigger, navigate to the Management -> Stack Management -> Connectors dashboard.
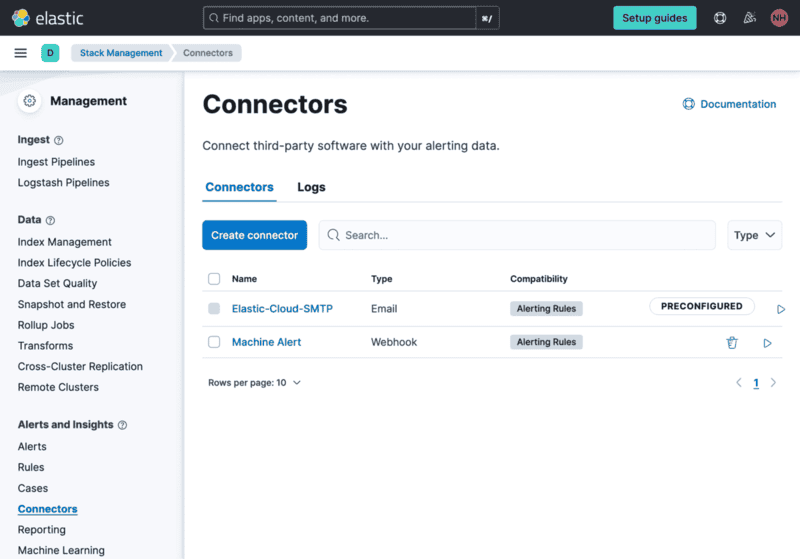
- Click on the triangular play icon in the row for "Machine Alert" to open the "Test" panel for the connector.
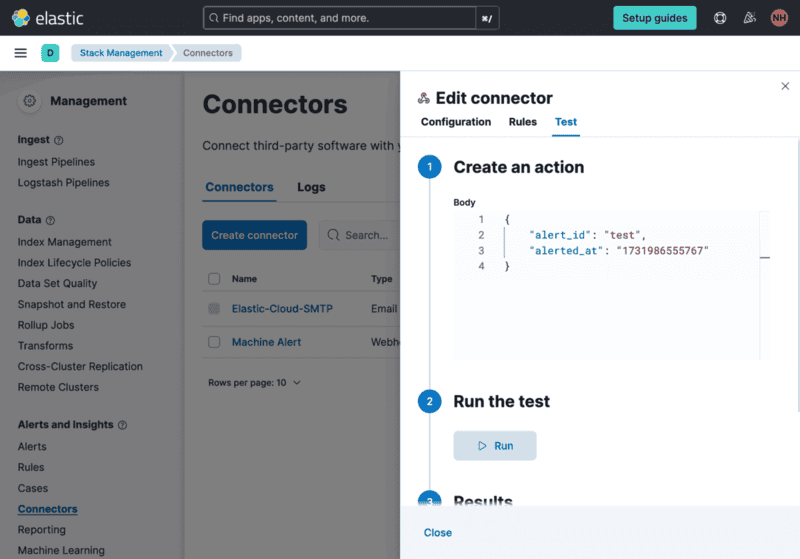
- Enter some fake data in the body of the "Create an action" field.
{ "alert_id": "test", "alerted_at": "1731986555767" } - Click the "Run" button and wait for your machine's LED to start blinking!
Well done putting all those pieces together! 👏 Now you have a production-ready sensor data monitoring and automation system built around Viam and Elastic.
Some great next steps include:
- Deploying the serverless functions: You don't need to run them indefinitely on your computer. This example uses Google Cloud Platform, but you can also work with other serverless platforms.
- Modify the sensing: Swap out the sensor to one that detects light, sound, or air quality.
- Modify the actuation: Instead of blinking an LED, the machine could move a servo or call out a notification with text-to-speech.
What You Learned
- how to wire a movement sensor and LED to a Raspberry Pi
- how to capture sensor data in Viam
- how to use webhooks as an ETL process between Viam and Elastic
- how to use webhooks to blink an LED based on an Elastic alert